Creating Simple Maps with QGIS
As a follow-up to the introduction to creating GeoJSON files</a>, this tutorial focuses on visualising these geodata in the open source Geographic Information System QGIS (https://www.qgis.org/en/site/).
QGIS must be installed on your hard drive, which means it is only suitable for users who have administrator rights on their computers. Otherwise, the browser-based platform Mapbox (https://www.mapbox.com/) can be used to create printable maps, though it is less intuitive to use.
The QGIS user interface is similar to image editing software and allows both the import of standardised geographical data from various sources and its display on different base maps. Most base maps, however, require (commercial) usage rights.
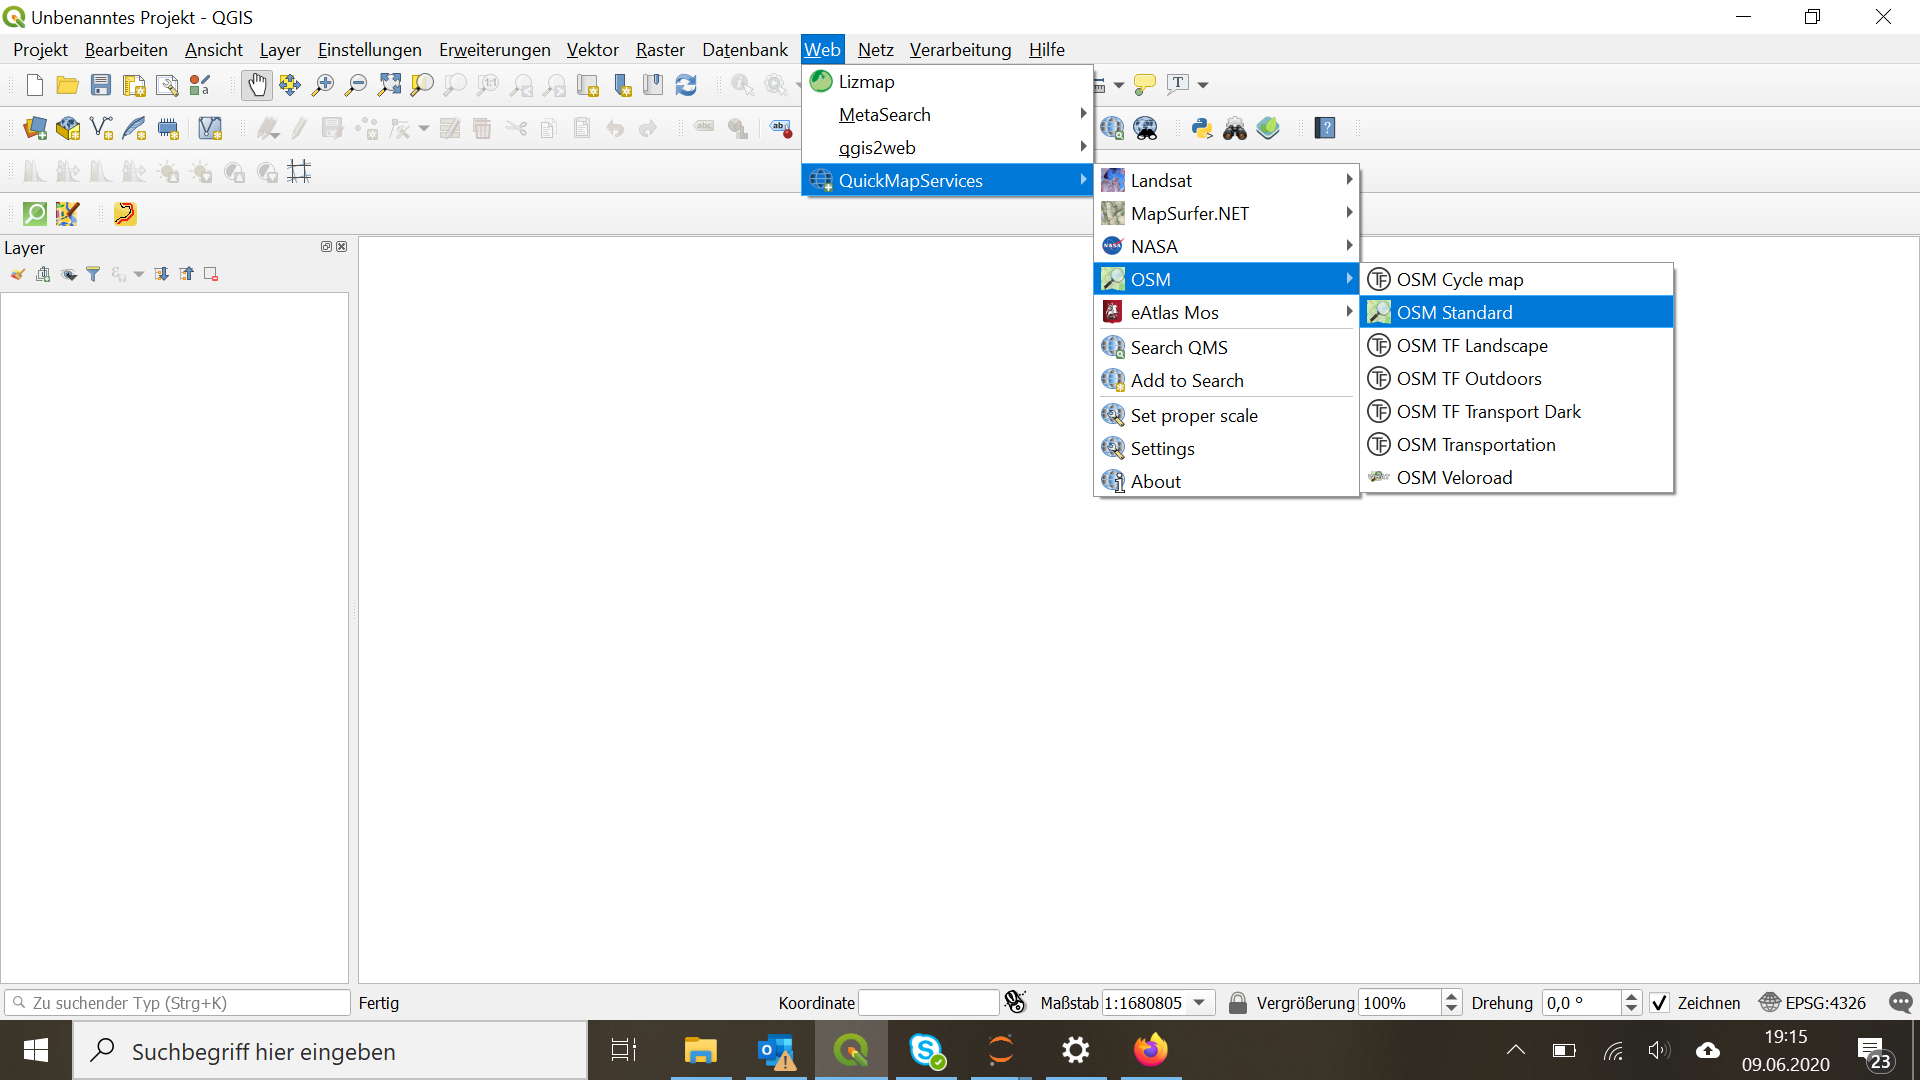
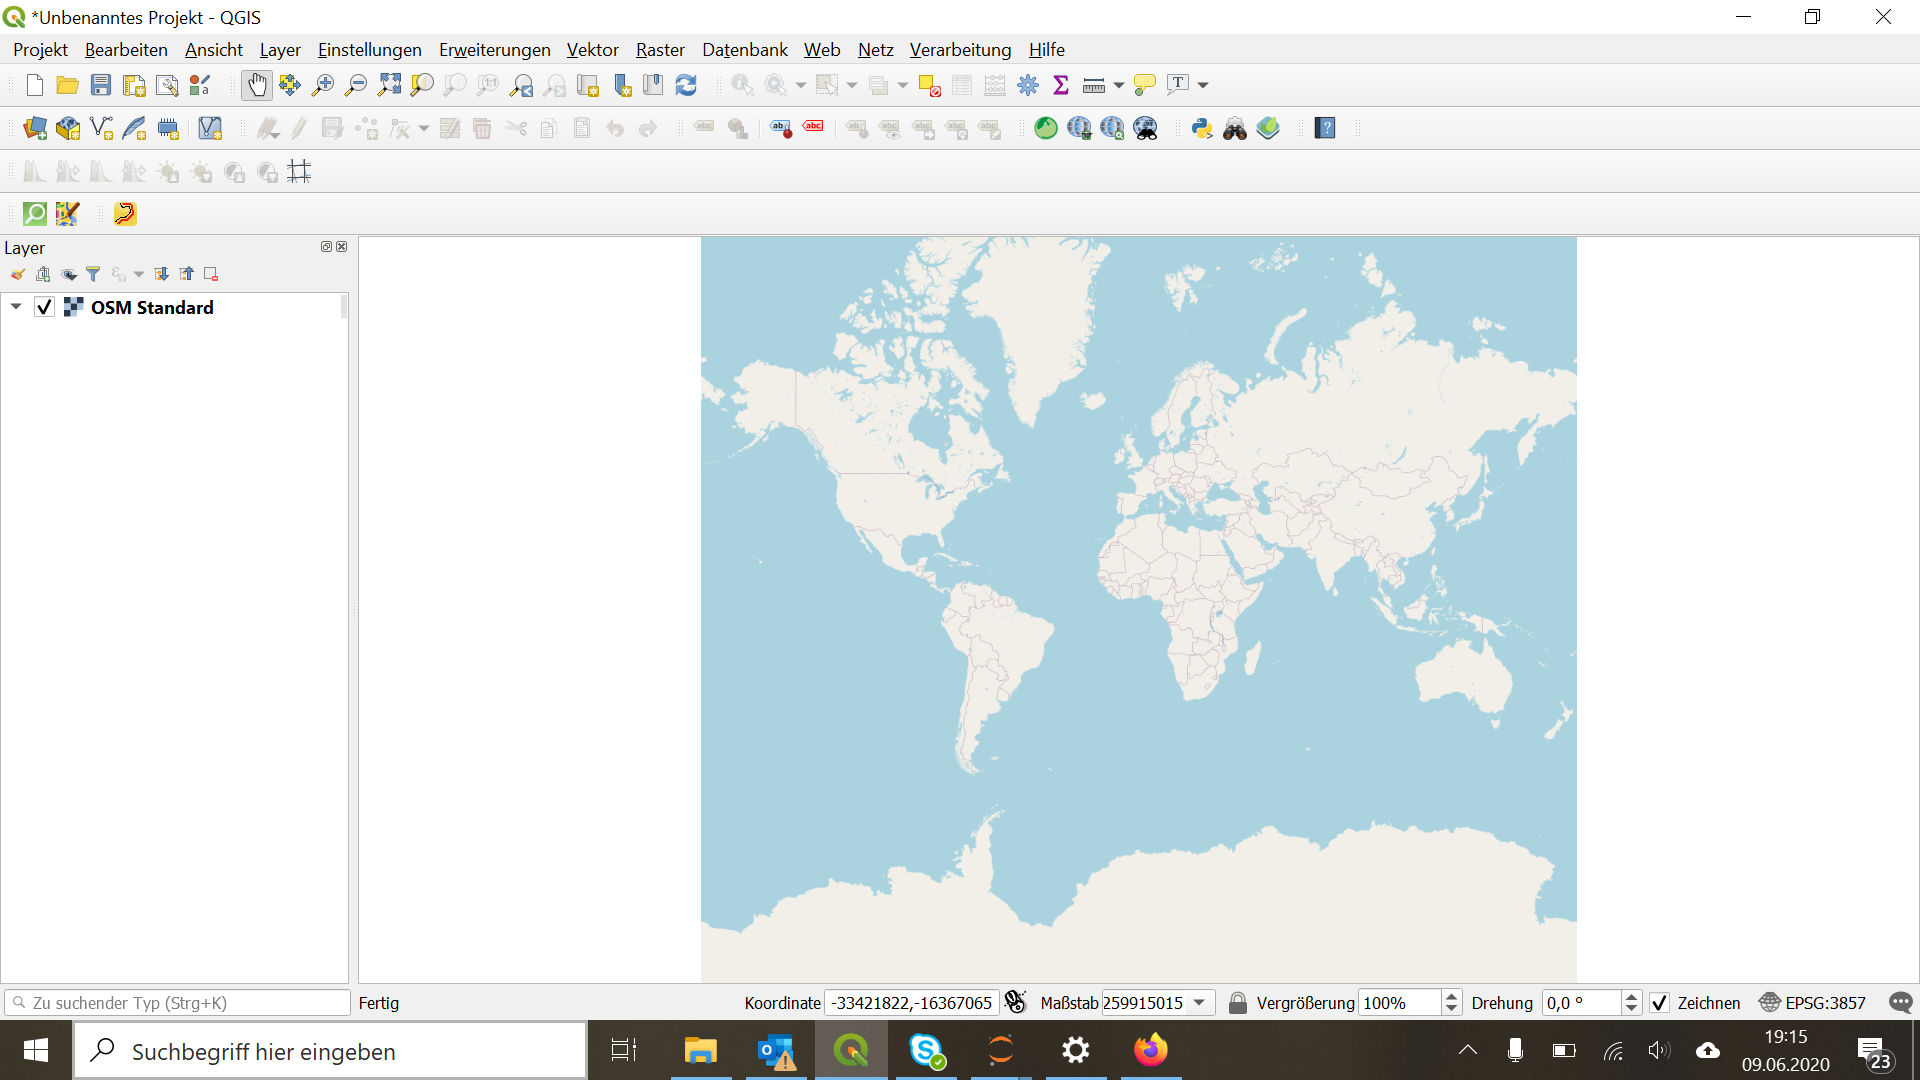
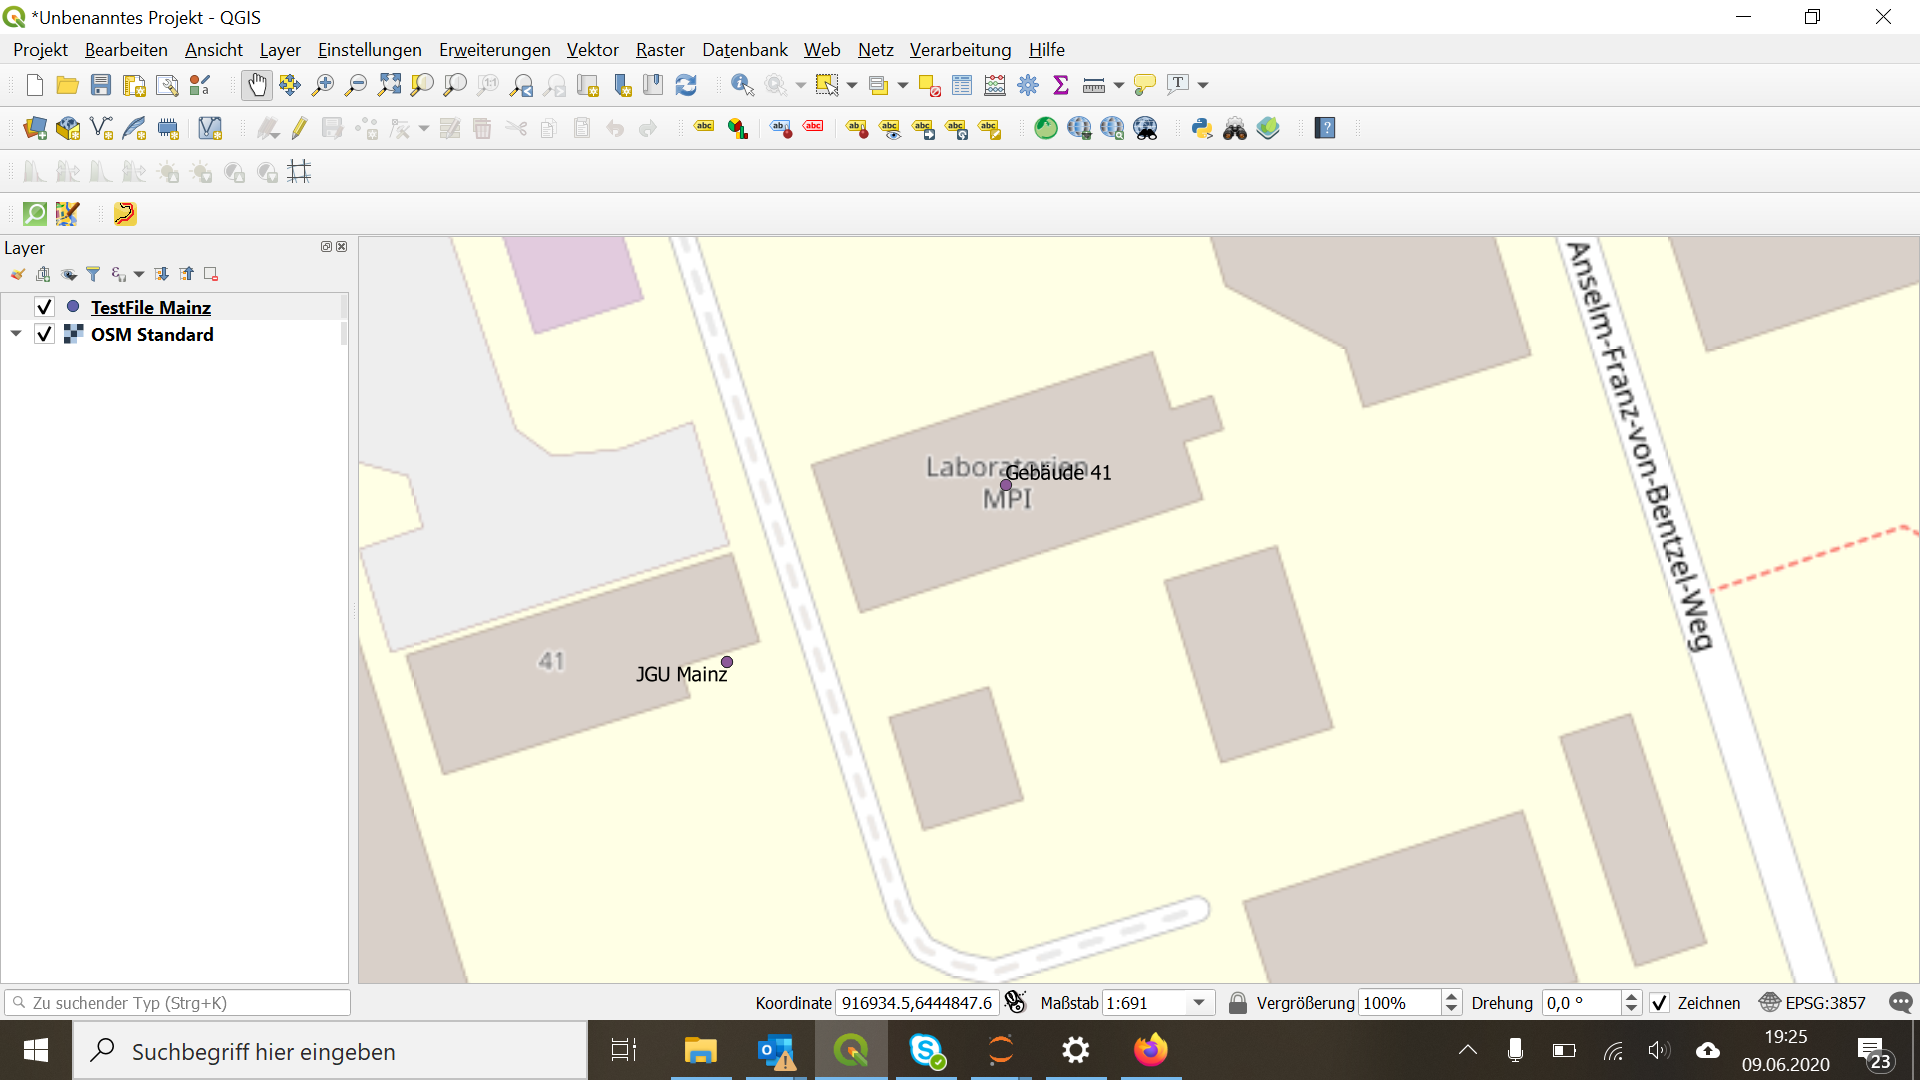
One free base map is the Open Street Map standard map, which can be loaded in QGIS via the "Web" tab. However, this map is only recommended for historical applications if user orientation in space is the priority, as modern borders and infrastructure are visible. Additional free base maps can be installed via various QGIS plug-ins and also accessed via "Web".
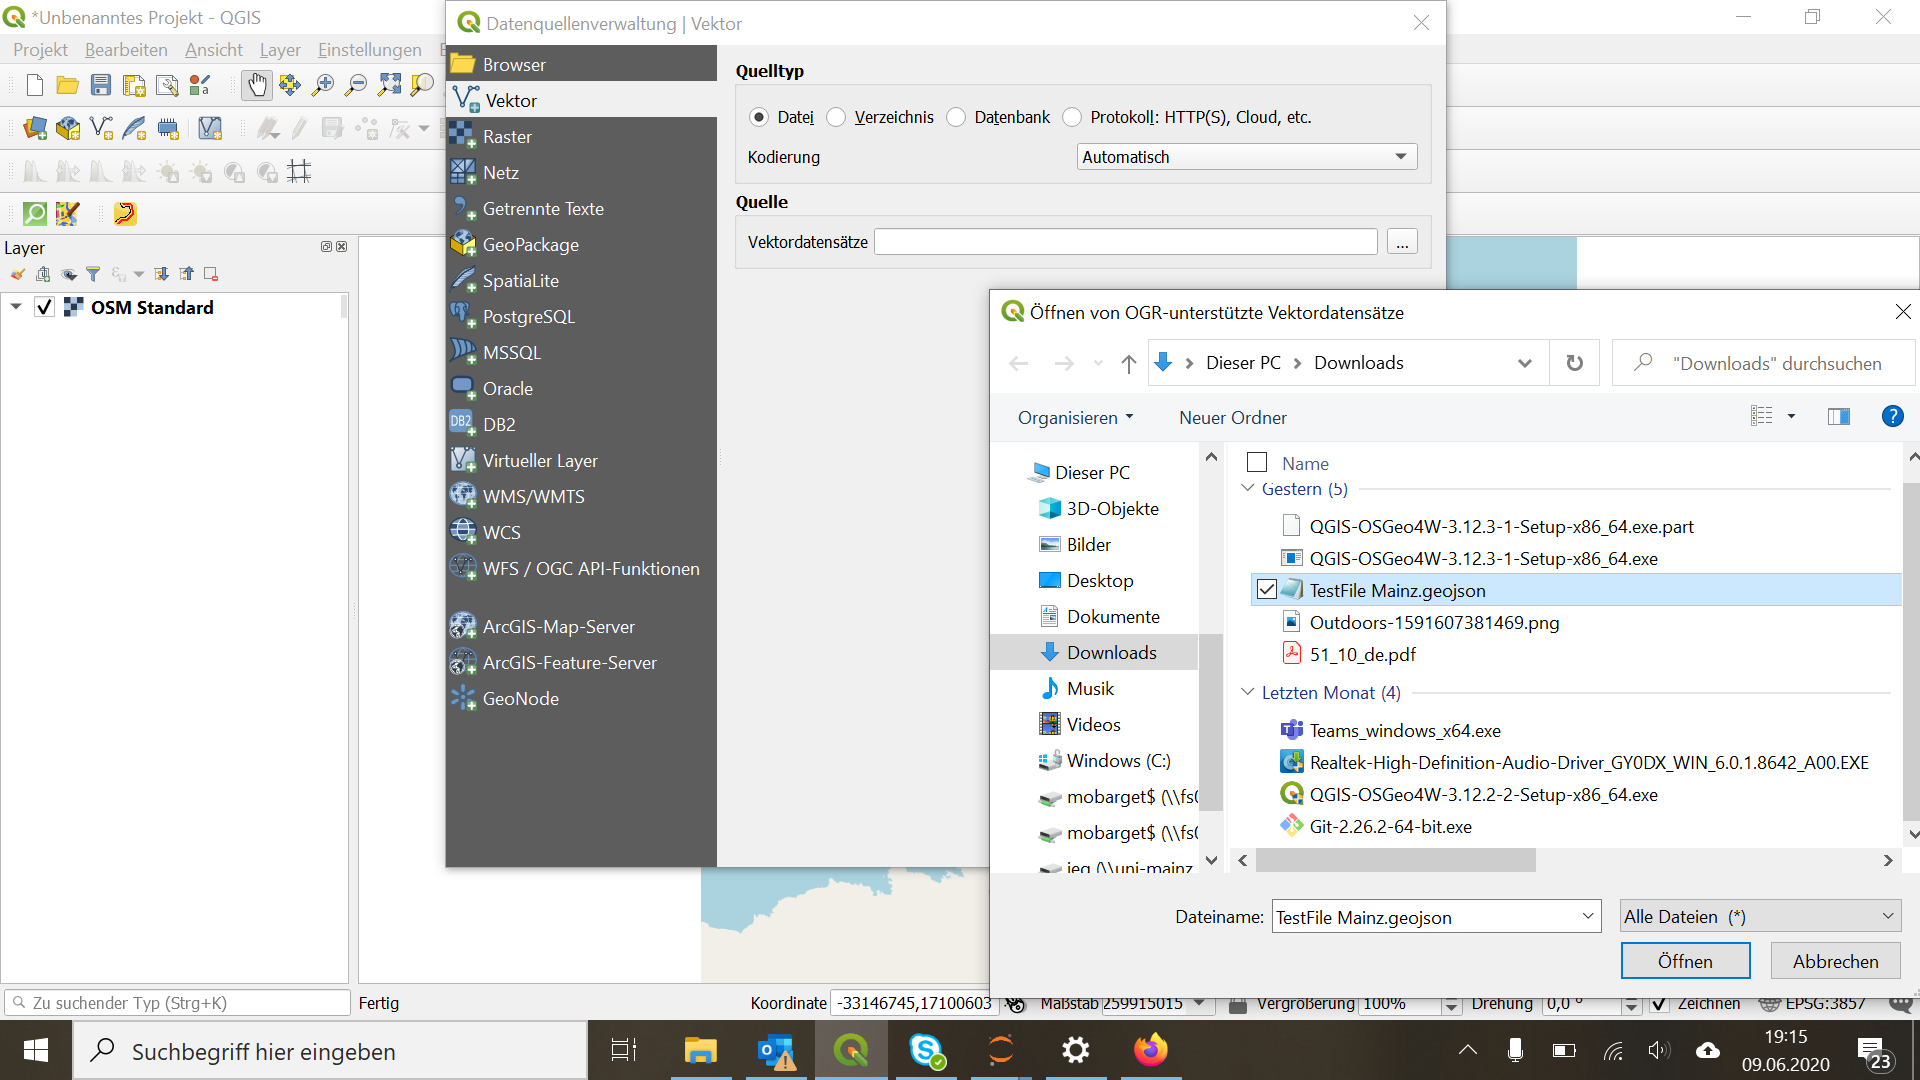
The previously prepared GeoJSON files are added as new vector layers via "Add Layer".
It is important to set an appropriate geographic projection ("set CRS") for both the base map and all data layers to ensure that spatial data is correctly aligned.
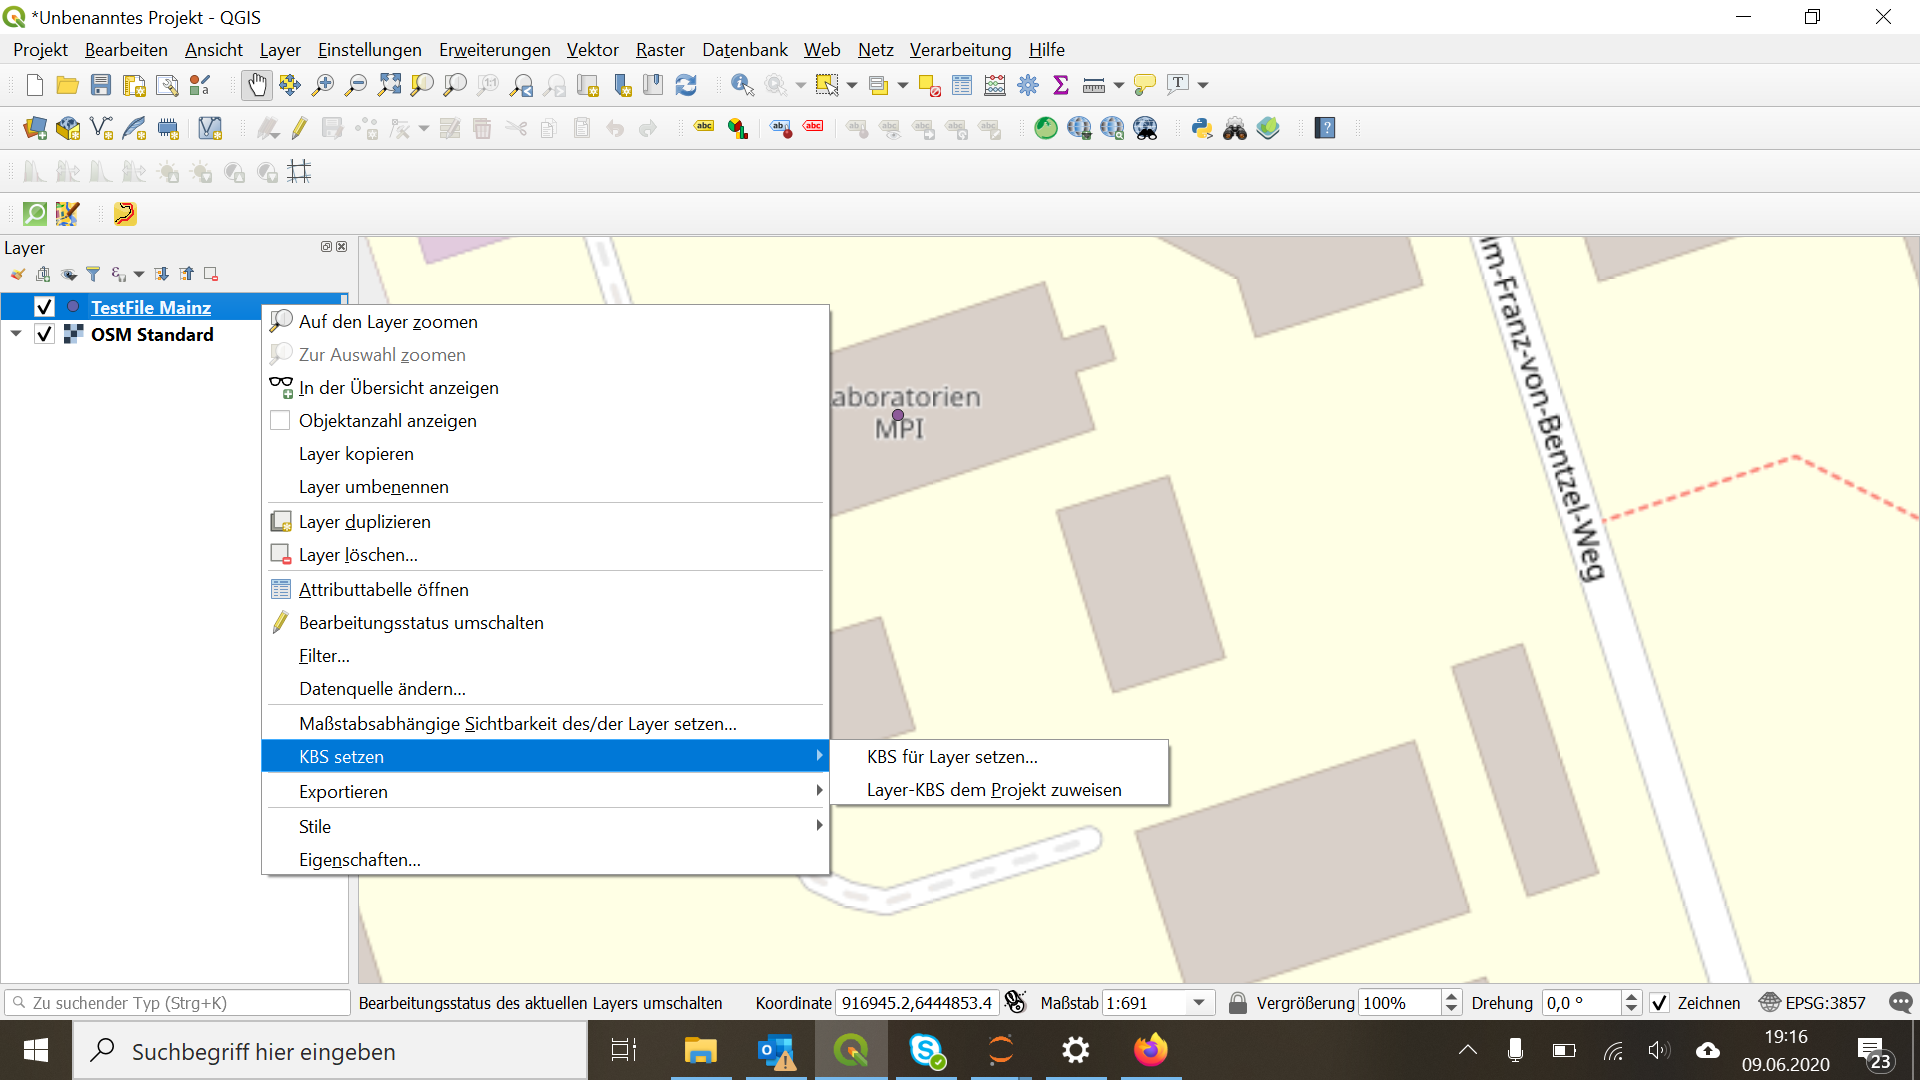
You can then change the appearance of the data layers via "Properties".
QGIS offers the following functions:
- Change map symbols, their size and colour
- Add labels
- Scale-dependent visibility of map elements
- Define data dependencies
- Data descriptions
- Data repair tools
- 3D views
- Data charts
- Selective masking or visibility of symbols
- Management of user forms
- etc.
There are detailed video tutorials for these functions (e.g., the series QGIS 3 for Absolute Beginners by Klas Karlsson) as well as the official QGIS documentation.
For simple maps, the label function is often the most relevant.
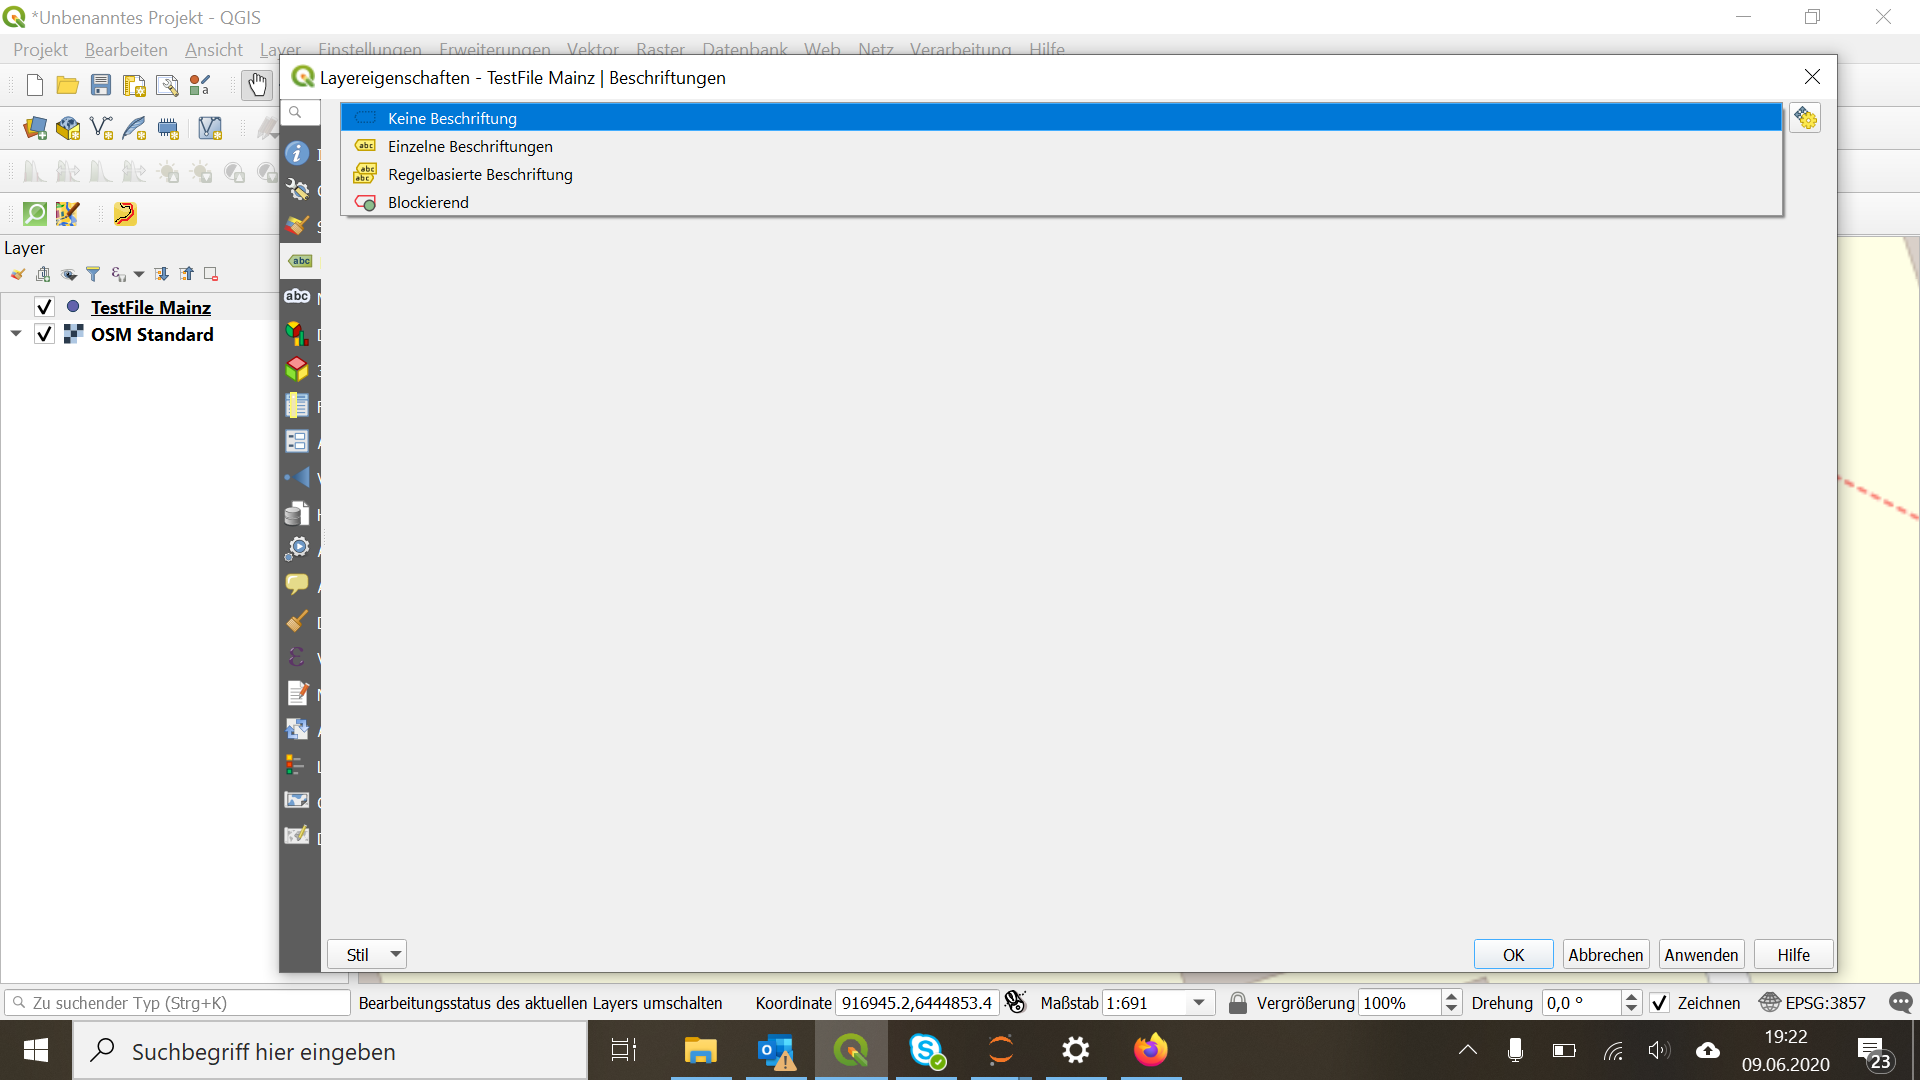
You can either choose a single label per map element based on a specific attribute (e.g., "Name") or define labelling based on (mathematical) rules. A detailed explanation of various label functions can be found in Lesson 4.2 of the QGIS documentation.
Since maps created in QGIS are often needed for publication in academic journals or posters, it is also important to become familiar with QGIS's "Print Layouts". Preparing specific maps or map sections for print is unfortunately not entirely straightforward in QGIS, so watching a video tutorial is highly recommended. In German, there is a video series by Marshal Mappers. A new print layout is opened via "Project -> New Print Layout".
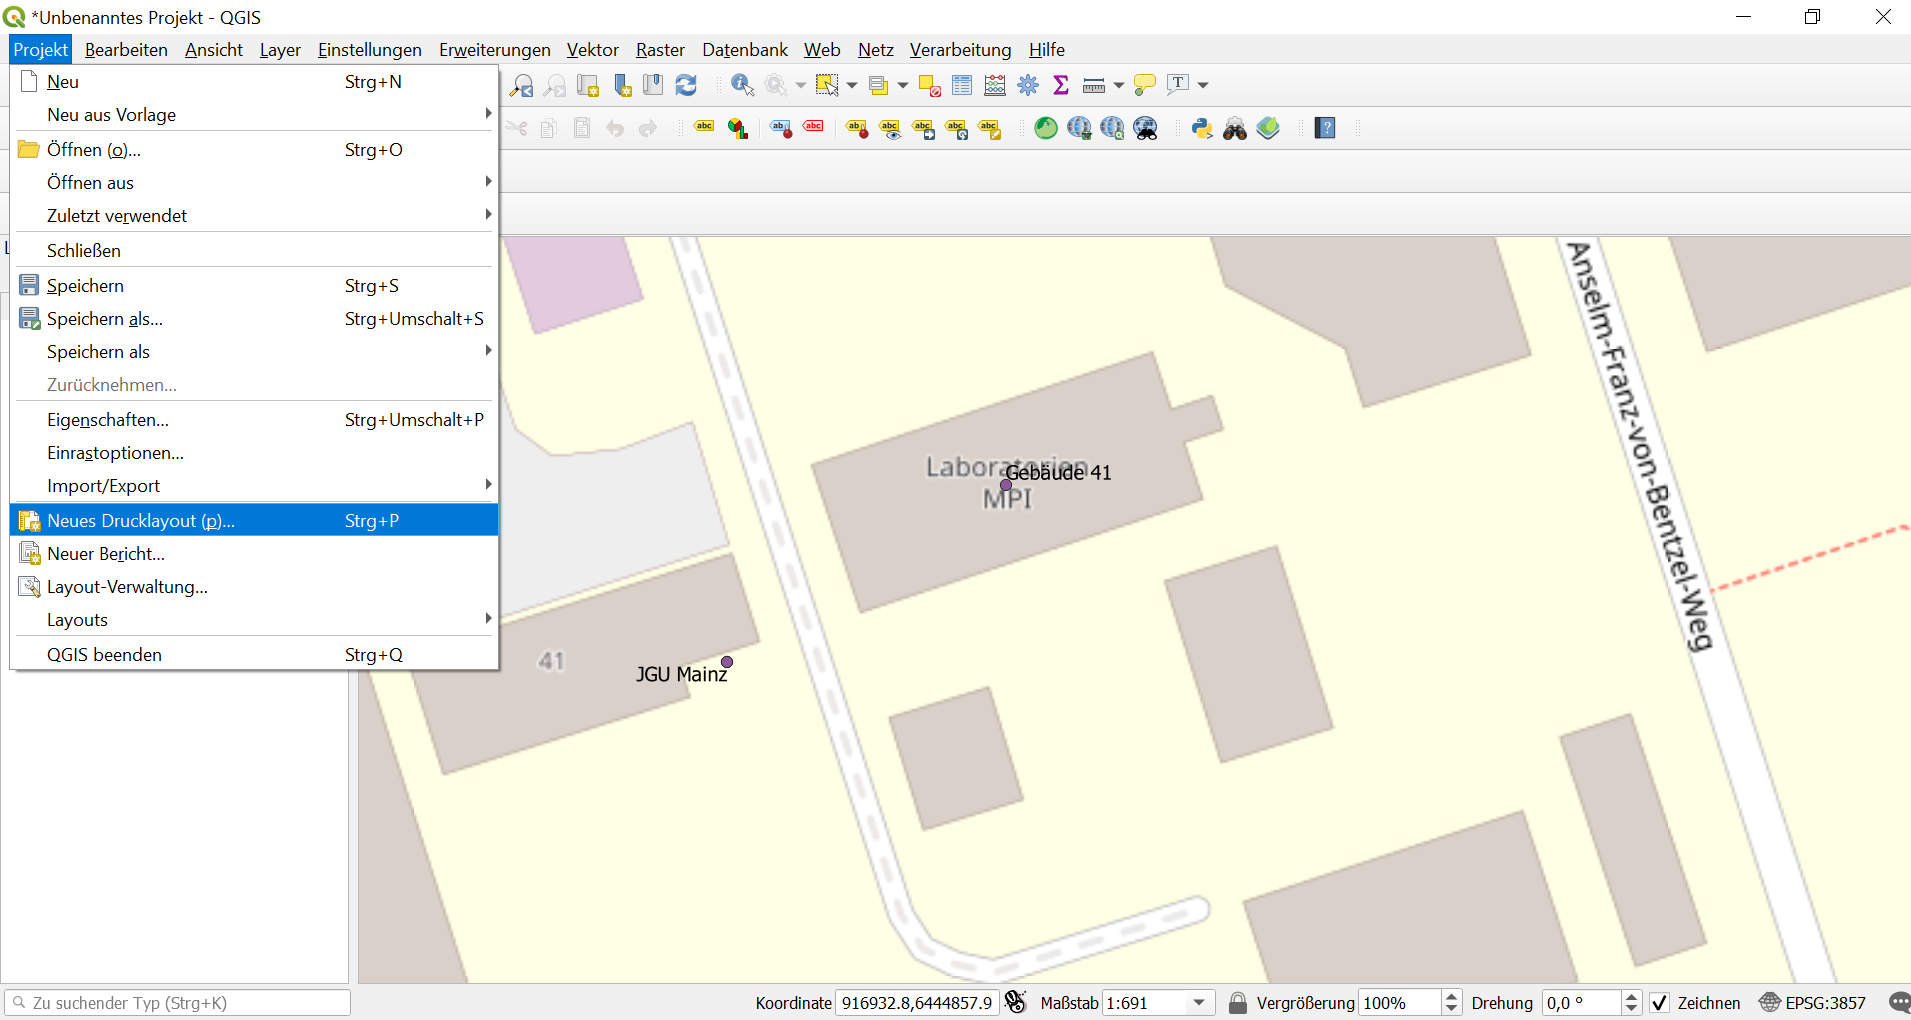
Each print layout must be given a unique name. Within the print layout, the current map section or the section to be printed must be loaded separately. The individual steps are explained in more detail in the German-language video QGIS 3 – Tutorial – Map Layout Part 1.
In the print layout, attribute information can be displayed either as labels or in a map legend. The legend can be given a freely chosen title. The layout and element properties can be adjusted in the panel to the right of the map. Including a legend is particularly advisable for dense map images with many labels.

This step is described in more detail in Lesson 5.1 of the QGIS documentation. It is also worth checking questions and answers from the GIS community on GIS Stack Exchange or asking a question of your own.